
Network Analysis of Nanoparticles


A complex network approach for nanoparticle agglomeration analysis in nanoscale images. Journal of Nanoparticle Research. 19:65 (2017) 
Drug delivery in cancer treatment and diagnostic tests, medical devices, chemotherapeutic agents.
Medicines for cardiology, osteoporosis and pulmonary, vaccines for most diseases and illnesses, smoking cessation.
Shampoos, sun screen, comestics and dental creams.
Special ocular liquids and surgical instruments.
Nutritional and managing-obesity products.
Solar panels, semi-conductors, sensors and displays.
Ceramics, textile, and building materials.
Complex networks have been widely used in science and technology because of their ability to represent several systems. One of these systems is found in Biochemistry, in which the synthesis of new nanoparticles is a hot topic. However, the interpretation of experimental results in the search of new nanoparticles poses several challenges. This is due to the characteristics of nanoparticles images and due to their multiple intricate properties; one property of recurrent interest is the agglomeration of particles.
Addressing this issue, we proposed a solution based on complex networks to detect and describe nanoparticle agglomerates so to foster easier and more insightful analyses. In this approach, each detected particle in an image corresponds to a vertice and the distances between the particles define a criterion for creating edges. Edges are created if the distance is smaller than a radius of interest. Once this network is set, we calculate several discrete measures able to reveal the most outstanding agglomerates in a nanoparticle image. The following images illustrate our method and tool.
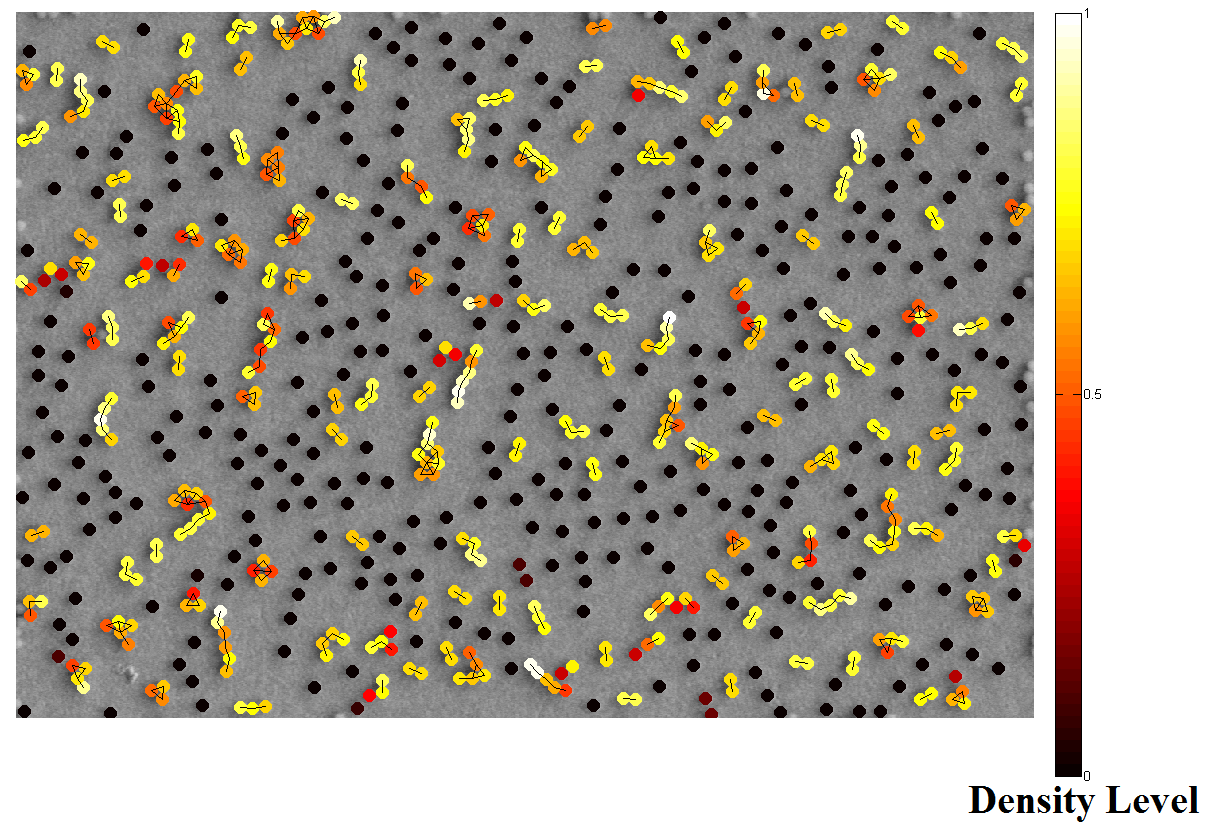
Experimental results using images of Scanning Tunneling Microscopy (STM) of gold nanoparticles demonstrated the effectiveness of the proposed approach over several samples, as reflected by the separability between particles in three usual settings. The results also demonstrated efficacy for both convex and non-convex agglomerates. In the image, edges are created only between vertices separated by a distance smaller than a radius of interest.
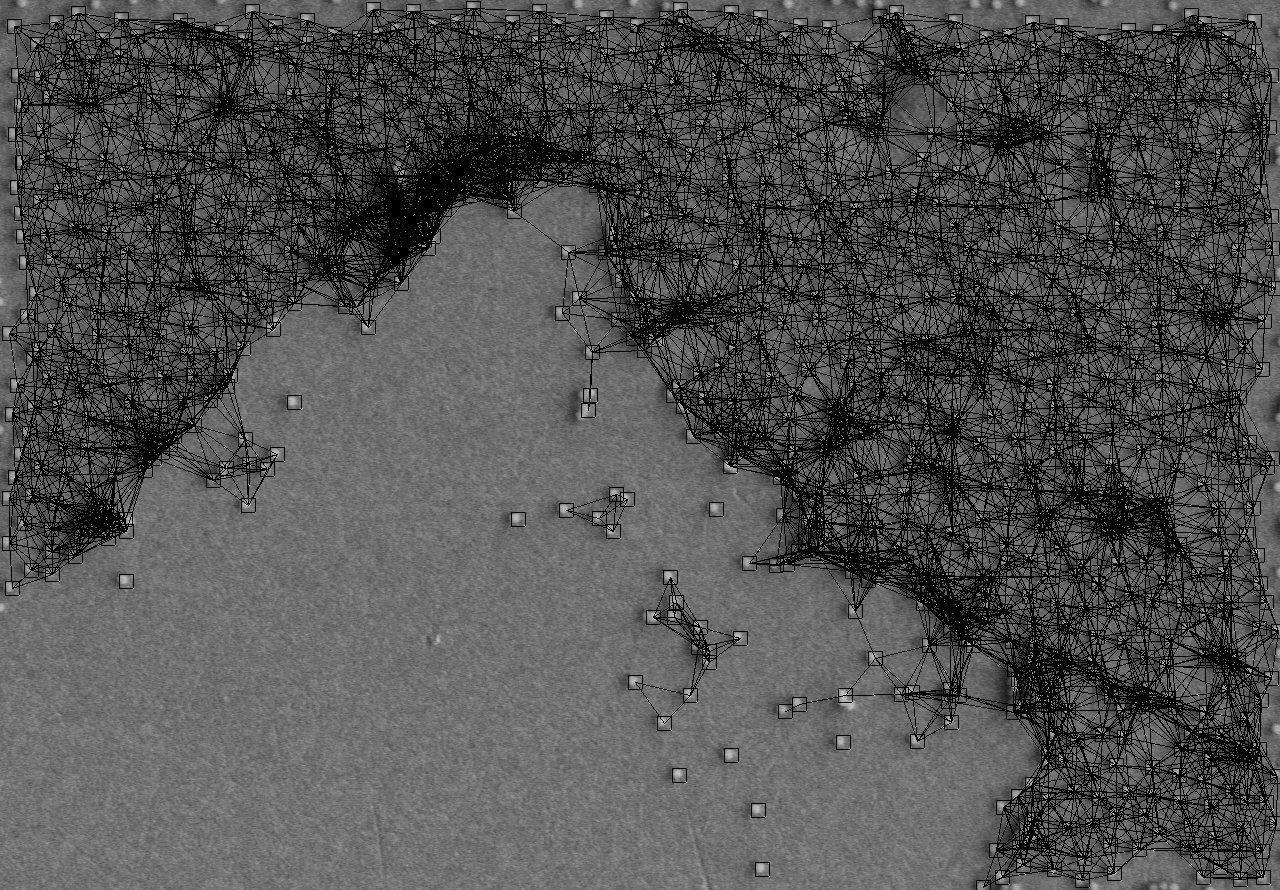
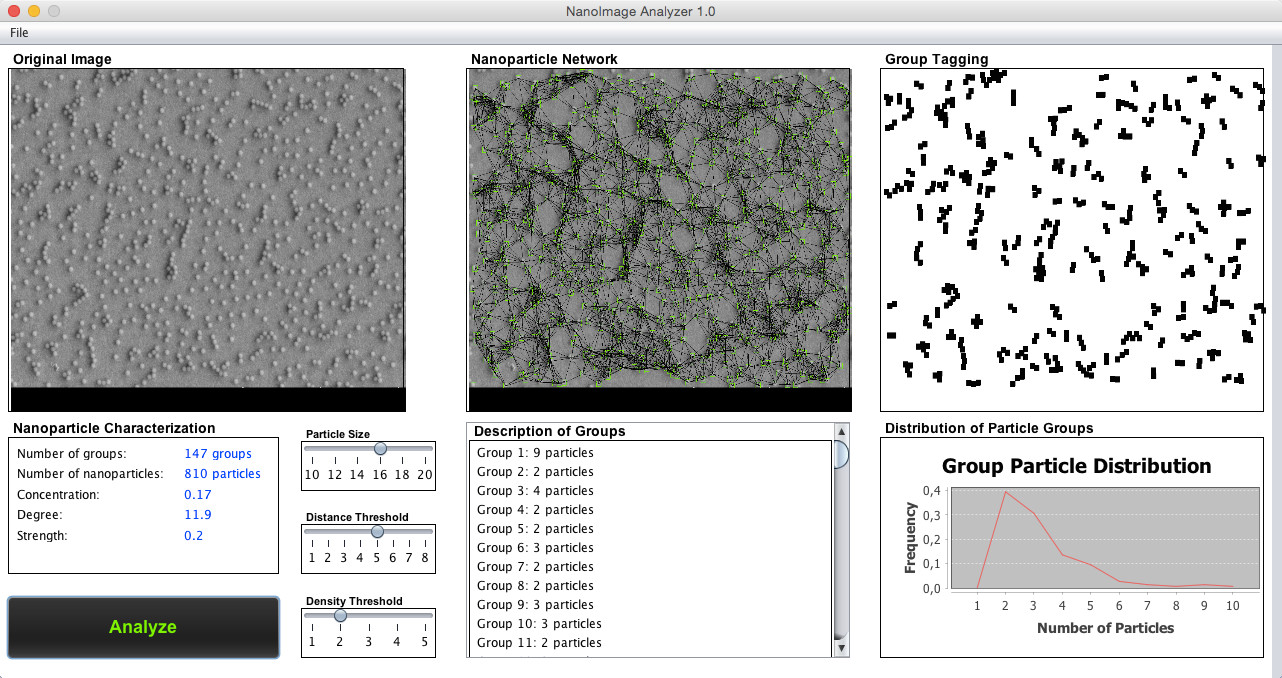
Illustration of the NanoImage Analyzer. At the left, the original image; in the middle, the complex network according to our method; at the right, the set of nanoparticle agglomerates.
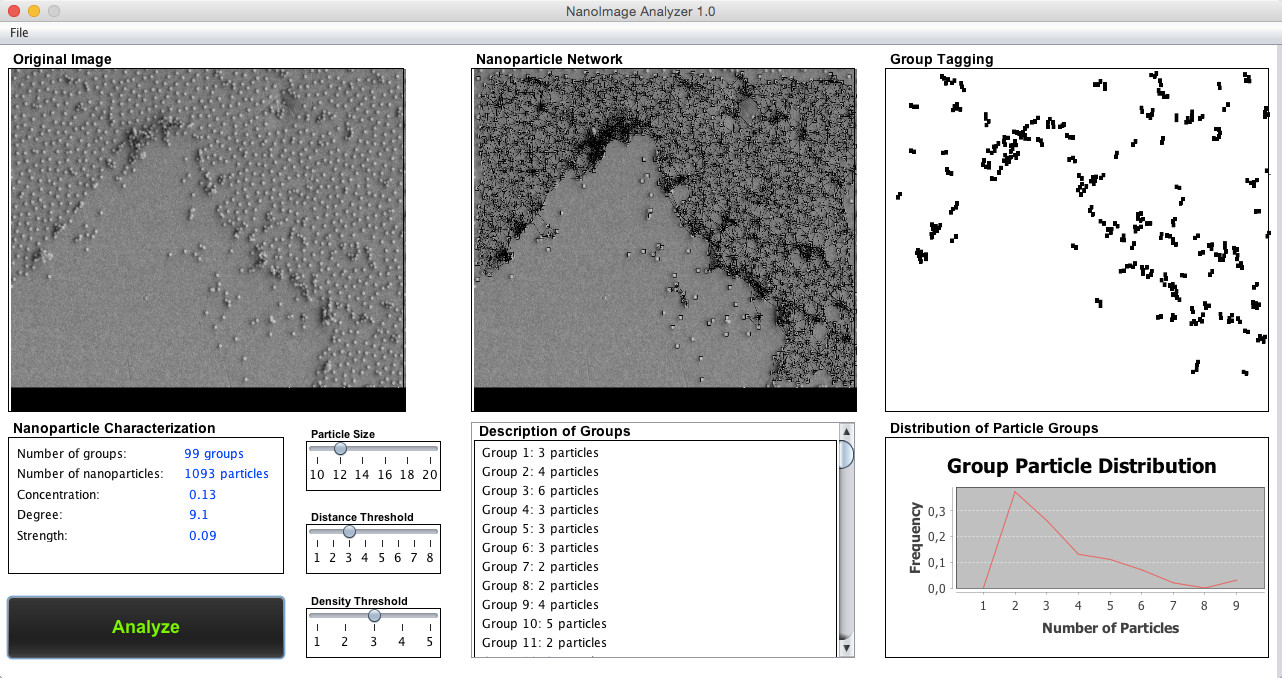
A second example, now considering a much denser image with intersecting agglomerates.
Please, download the java jar file NanoImage Analyzer (~4MB, Last Update on February 23, 2017 - version 1.8). NanoImage Analyzer works on different systems, including Microsoft Windows, Mac OS X, and Linux-like systems.
To run the NanoImage Analyzer:
* If you make any change in the sliders you should click again on the Button Analyze.
The description of agglomerates, the network visualization, and the group formation are showed in the other panels. In the main window, you can see at the left-bottom the distribution of agglomerated particles, calculated by the frequency of agglomeration.
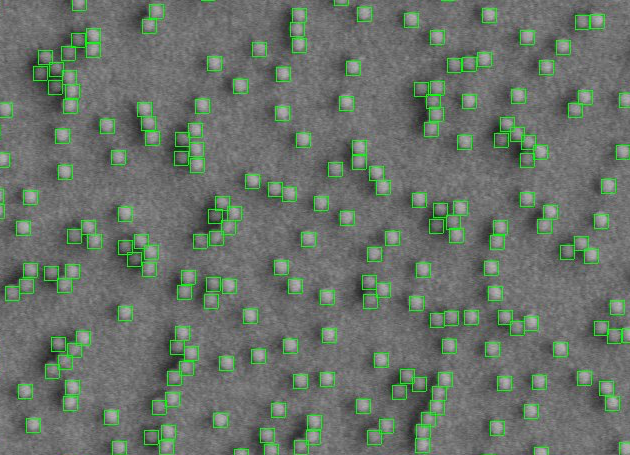
Click to donwload the sample image and its correspondent data file with the coordinates of the nanoparticles.
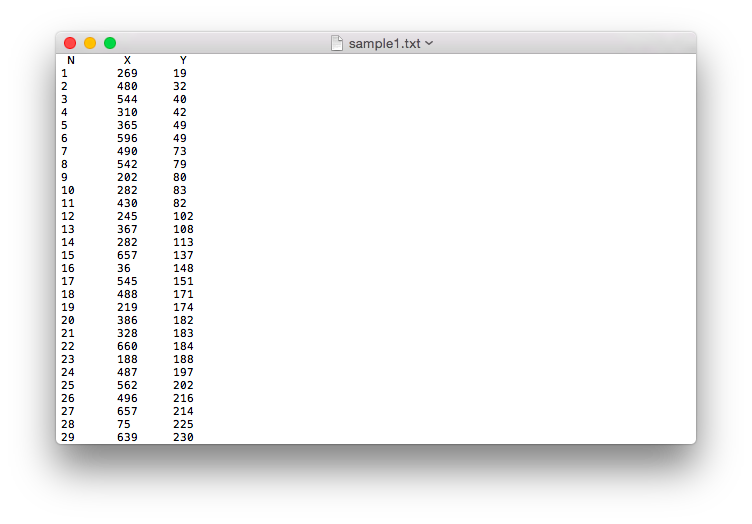
The data file has three columns: number of the nanoparticles, coordinates X and Y; they are separated by tabulation. The image below shows the coordinates of the sample1.txt
If you have questions or suggestions, you can send us an email to brunobrandoli gmail com